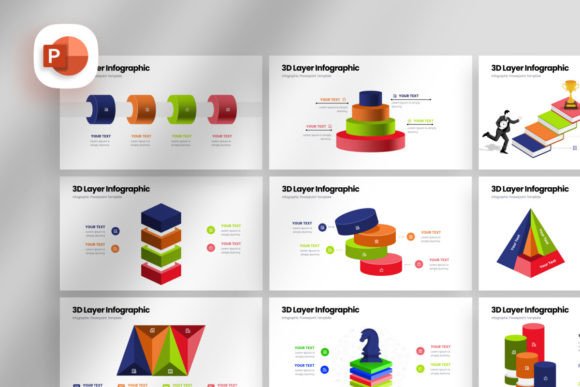
Elevating Communication Through 3D Layer Infographic Presentation Design
At its core, a 3D Layer Infographic Presentation isn’t just a collection of slides—it’s a structural thinking framework. It transforms flat bullet points and dense blocks of text into stacked, dimensional visual narratives. The specific asset we’re examining is a professionally built PowerPoint and Google Slides-ready template containing 37 responsive slides, each composed of fully vector shapes. Every element is editable on a master slide level, with drag-and-drop image placement and no requirement for graphic design expertise. This practical toolkit makes business illustration straightforward, but its real strategic value lies in how it reshapes the way you construct and deliver ideas.
Why Hierarchical Seeing Matters in Modern Business Communication
We live in an era of information saturation. Whether you’re pitching investors, training staff, or presenting a strategy to the board, clarity is currency. A 3D Layer Infographic works because it mirrors how the human brain processes complexity: by identifying layers of priority. When you use a layered graphic to break down a business model, a product architecture, or a marketing funnel, you give your audience a visual map. They grasp the foundation first, then the intermediate structures, and finally the surface-level outcomes—without cognitive overload. This approach is far more effective than sequential slides that demand constant memory recall. It anchors understanding, keeps the conversation focused, and positions you as a communicator who values your listener's time.
Strategic Groundwork: What This 3D Layer Infographic Template Actually Includes
Before you open the file, understand what you're gaining beyond a set of pretty pictures. This is a system designed for responsive, 16x9 HD ratio displays—a standard that guarantees your visuals scale correctly across screens. The full metric set matters because it dictates workflow flexibility:
- 37 Unique Slide Layouts: Not random variations, but a deliberate sequence that supports a logical narrative arc. You can build from concept definition, through procedural breakdown, to financial projections and summary insights without re-engineering the visual language.
- Vector Shape Architecture: All elements are resolution-independent. You can scale a diagram to full screen or reduce it for a handout, and lines stay crisp. Curves, icons, and connector lines maintain integrity, which is critical for professional output.
- Drag-and-Drop Image Integration: Instead of wrestling with clipping masks and aspect ratios, placeholders are built into the master slides. This reduces formatting hours to seconds and keeps your focus on message, not mechanics.
- Free Font Use Policy: Typography choices are anchored in openly available fonts, eliminating legal risks and platform compatibility issues. Consistency across contributor machines is immediate.
- Master Slide Controls: Bulk edits—color shifts, logo insertion, background styling—apply globally without breaking the underlying logic of each slide. This is where one-time setup saves enormous repetitive effort.
Note: Stock photography is not bundled. This is deliberate; it forces you to supply authentic imagery relevant to your context rather than relaxing into generic office scenes. That trade-off actually elevates your final deck’s originality.
When 3D Layers Outperform Other Format Choices
Not every meeting deserves dimensional depth. A flat table might suffice for simple inventory updates. But when you need to illustrate dependency, process flow, or comparative scale, a 3D Layer Infographic becomes a structural advantage. Consider these high-return scenarios:
- Strategy Deployment Sessions: Display how corporate objectives cascade through business units to frontline actions. The layer logic (vision → strategy → execution → metrics) visually prevents key steps from being mentally skipped.
- Product Architecture Reviews: For software or service stacks, show infrastructure layers, API layers, UX layers, and user outcome layers in one coherent diagram. Engineering and commercial teams finally see how they connect.
- Investor Pitch Decks: A layered infographic on your market expansion plan or revenue model signals sophistication. Investors interpret clear layering as strategic maturity—it shows you’ve isolated variables and understand what levers drive what results.
- Educational and Onboarding Materials: New hires or students grasp a complex institution faster when they visualise departmental interrelation as an interactive-looking graphic, even in a static presentation.
The 37-slide structure of this template encourages you to sequence your introduction, problem definition, layered solution decomposition, and call to action in a rhythm that feels natural. Skipping this structure often leaves presenters with fragmented decks that bleed impact slide by slide.
How to Approach Setup Without Design Paralysis
The claim “no graphic skills required” is genuine if you approach the template methodically. The biggest mistake is opening the file and immediately moving shapes. Instead, do a 30-minute pre-design pass:
- Decide Your Core Metaphor: Is your story about building from the ground up (onion layers, geological strata, architectural stacking) or about peeling back complexity (transparent layers, x-ray views)? Choose one and stick to it across slides; the template’s vector shapes allow you to re-colour and re-arrange to support your chosen metaphor.
- Map Your Data to Layers: Draw a simple outline on paper first. Label “Base layer: Market Need,” “Middle layer: Our Solution Architecture,” “Top layer: Customer Experience Outcome.” Only then begin pulling corresponding slides from the template library.
- Use the Master Slide First: Set your colour palette globally. This template’s vector nature means even complex gradients remain editable. Test high-contrast view modes to guarantee accessibility. Then lock your brand colours and fonts.
- Gather Authentic Visuals: Since stock photos aren’t included, prepare screenshots, product photos, process diagrams, or data charts. Drag them into the prepared placeholders. Replace icon-oriented vector objects that carry no meaning with ones that do, leveraging the free font set’s compatible symbol libraries.
- Review as a Narrative Arc: In slide sorter view, strip away any 3D layer infographic slide that does not directly serve your decision-making audience. The template is generous; your delivery should be surgical.
The Analytical Edge: Rendering Complex Data as Spatial Logic
Most spreadsheets obscure interdependencies. When you lift a financial model into a layered graphic, you force disclosure of relationship. One slide from the template set might assign product lines to separate 3D bands, with the length or thickness of each band representing revenue contribution. Below, a layer might illustrate fixed-cost allocation. Above, a semi-transparent band could show margin ranges. Decision-makers can literally point at the bandwidth and ask: “What would it take to widen this segment?” This conversational specificity is impossible with a raw data table.
A practical example: A marketing director uses 12 of the 37 slides to map the customer journey. The bottom layer showcases infrastructure data—website traffic sources. A middle layer represents behavioral engagement—time on page, scroll depth, content interaction. The topmost layer reflects commercial outcomes—conversion rate, average order value, repeat purchase rate. Stakeholders now see why a content gap matters, because its negative effect ripples upward through visual layers. Insights emerge naturally.
Risk Management: When Dimensionality Hurts Clarity
There is a seductive quality to layered, isometric, and 3D-esque graphics. Without discipline, you risk creating skeuomorphic noise that confuses rather than enlightens. Before you rely on this 3D Layer Infographic presentation template, audit each slide for functional purpose. If a third dimension is used merely as decoration, it can mislead your audience into seeking depth where none exists. A pie chart with an extruded 3D edge, for instance, distorts angular perception and can alter perceived proportions—use stacked layers for categorical comparison only when layer position signifies hierarchy.
Other mitigation steps:
- Set a constraint rule: Three to four depth layers per graphic is usually optimal. Beyond that, visual parsing time increases and retention drops.
- Maintain consistent lighting and shadow angles across all vector shapes; the template likely already standardises this, but as you customise, resist the urge to mix angular perspectives.
- Test on a mobile screen. A 16x9 HD ratio slide viewed on a smartphone should still communicate its primary insight, even at reduced scale. If it doesn’t, your layer labels or contrast choices need refinement.
- Never use layered graphics to disguise a weak argument. The template is an amplifier, not an eraser. An audience will see right through a beautiful house of cards if the underlying data lacks rigour.
Long-Term Positioning: Building a Reusable Visual Asset Estate
The value of a vector-based 3D Layer Infographic Presentation template extends beyond a single meeting. Because the master slides and elements are fully editable, you can create a family of presentations for quarterly business reviews, team stand-ups, and annual strategy retreats—each sharing visual DNA. Teams begin to associate certain layer colours or spatial metaphors with specific types of business logic. Over time, this drastically reduces on-boarding time for new contributors and creates a consistent brand voice at the visual communication level.
To future-proof, export your most frequently used layered infographic slides as a separate template subset. Keep the original 37-slide file pristine as a library; work from a copy. When your strategy evolves, you can swap underlying data in a vector layer without rebuilding the entire diagram. This saves tangible operational hours and maintains a polished, professional standard with minimal marginal effort.
Smart Adoption: Is This Package Aligned With Your Current Goals?
Before downloading or purchasing, define the gap this asset fills. If you currently spend three hours polishing slide layouts for every internal review, the drag-and-drop and master slide efficiency alone will free up meaningful calendar space. If you’re a freelancer or agency owner, the template becomes a client-facing differentiator—you can present your thinking not just in text but in a structured, layered format that suggests thoroughness. However, if your presentations are predominantly one-on-one conversations over a coffee shop table, a simpler document might be more appropriate.
For decision-makers evaluating this 3D Layer Infographic Presentation asset, weigh the following questions:
- Will the majority of your slides benefit from dimensional layering, or is it only occasionally useful? The 37-slide bulk supports heavy users, but even a subset of five layered slides leveraged strategically can transform a deck.
- Do you have the raw content ready? A template accelerates design but does not generate substance. Gather your strategic data, process maps, and outcome metrics before you start.
- Is your audience visual-first? Technical teams might appreciate layer-based architectural diagrams, while a board focused purely on financial ratios might need the layers translated into more traditional summary views. Use the template to serve audience preference, not your own comfort.
The free font usage eliminates the hidden cost of typeface licensing, and the vector shape property guarantees longevity through software updates. These are practical details, but they signal a creator mindset focused on the end user’s operational reality. In a market flooded with templated fluff, this focus on functional editability is a signal of quality. Approach it not as a quick-fix cosmetic kit, but as a modular infrastructure for your communication strategy. When you map your purpose onto its structure rather than the other way around, you unlock the kind of clarity that moves decisions forward—and that, ultimately, is the only metric that counts.