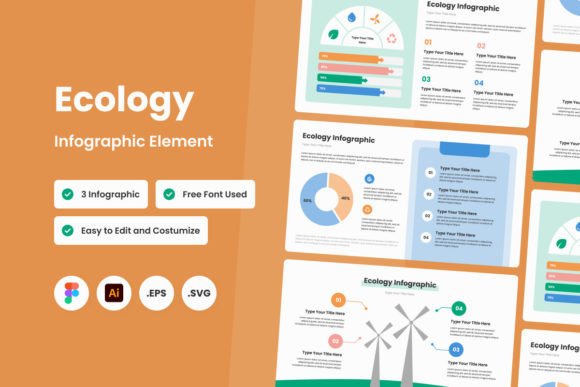
Ecology Infographic Template V4: Turning Environmental Data Into Clear, Impactful Visuals
Communicating environmental data often lands at a frustrating crossroads. The numbers are solid, the research airtight, but the moment you present a table of figures or a dense PDF, the audience’s attention drifts. Ecology Infographic Template V4 exists to bridge that gap—to take scientific rigor and translate it into something people immediately understand, remember, and act on. Whether you’re briefing policymakers, running a classroom workshop, or building a public awareness campaign, this collection of pre-structured layouts removes the friction between raw information and a finished visual story.
Why Environmental Conservation Needs Better Visual Storytelling
Most conservation initiatives don’t fail because the data is weak. They fail because the data never reaches the right people in a form that resonates. Busy stakeholders skip long reports. Social media feeds scroll past text-heavy posts. A community meeting can lose its momentum when slides look like spreadsheets. In each case, the underlying problem isn’t the message—it’s the packaging.
Infographics solve that packaging problem by aligning with how the brain processes information. Visual patterns, color-coded data points, and spatial relationships make abstract concepts tangible. When you show deforestation rates through a comparing side-by-side map and bar chart rather than a paragraph, the trend hits instantly. That speed of comprehension is critical when advocacy windows are narrow and decision-makers need a quick, confident grasp of the issue.
Where Ecology Infographic Template V4 Fits Into Your Workflow
Think of this template set not as a one-off design file but as a reusable framework that fits into the natural rhythm of any conservation communication project. You can slot it in at multiple stages—when you’re planning the narrative, assembling the draft, or refining final materials for different outlets. The value grows the more consistently you apply it across a campaign or reporting cycle.
Before You Start: Planning the Data Story
Every infographic begins with a question. What am I trying to convey, and who needs to understand it? Before opening a design file, gather your core data points, identify the single most important takeaway, and decide on the emotional tone—hopeful, urgent, analytical. Then browse the three unique design variations included in Ecology Infographic Template V4. Each offers a different layout rhythm: one might be more map-centric, another chart-focused, another timeline-driven. Pick the structure that best matches your intended narrative. This step saves hours of trial and error later because you’re not starting from scratch; you’re selecting a proven blueprint.
During Design: Populating and Personalizing
With the template open in your preferred software, begin swapping placeholder content with your actual data. Manually input figures, adjust chart labels, and drag in your own images to replace the preview photographs (note: the preview images in the product listing are for demonstration only; the main file contains empty placeholders ready for your assets). Thanks to neat layers—every element grouped and labeled logically—you can isolate a chart or text block without disturbing the surrounding layout. Modifying a color to match your organization’s branding, for example, becomes a one-click adjustment rather than a pixel-hunting exercise.
The open source fonts used throughout the template eliminate the headache of missing typefaces. Anyone opening the file sees the correct rendering without searching for commercial licenses. This is a small but important detail when collaborating across teams or sending files to a client for review.
During this phase, keep your focus on clarity. The template’s built-in visual hierarchy—headline size, supporting stat boxes, callout icons—guides your editing process. You don’t need to design from scratch; you just need to feed in the right information and trim what’s unnecessary.
After the Design: Adapting and Distributing
A single infographic rarely lives in only one format. The same content might appear in a presentation slide deck, embedded in a blog post, printed for a poster session, or shared on Instagram. Because Ecology Infographic Template V4 comes in multiple file formats—.Fig, .Ai, .Eps, and .Svg—you can export or open the design in Figma, Adobe Illustrator, or any vector-compatible editor. That flexibility means you create once and reshape without loss of quality. Need a square version for social media? Duplicate the artboard, adjust the crop, and tweak a few layer positions. The organized file structure makes this adaptation swift, allowing you to maintain visual consistency across channels.
Key Features That Streamline the Creation Process
Understanding the template’s design choices helps you work faster and with more confidence. Here is how each feature translates into a practical workflow advantage:
- 3 Unique Designs. Instead of one rigid layout, you get three distinct starting points. This is useful when you’re managing multiple projects—say, a water quality report, a biodiversity overview, and a recycling infographic—and want visual variety without losing a cohesive brand feel. You can also A/B test different versions with a focus group to see which communicates most effectively.
- Ease of Customization. Editable text, resizable charts, and interchangeable color palettes mean you’re not locked into the original aesthetics. If your organization’s guidelines call for specific blues and greens, apply them globally in minutes. The templates serve as a smart scaffold, not a restriction.
- Neat Layers. Every icon, text box, and background shape sits on a clearly named layer. When you need to hide a decorative element or move a statistic, you can find it instantly. This layered organization dramatically reduces the tedium of sorting through a flat, merged file.
- Open Source Fonts. No missing font warnings. No budget for typeface licenses. The templates use freely available fonts that render correctly on any system, which also simplifies collaboration with volunteers or partner organizations who may not have access to premium type libraries.
- Full File Formats (.Fig, .Ai, .Eps, .Svg). The inclusion of Figma format supports browser-based collaboration, .Ai and .Eps cater to print professionals, and .Svg ensures compatibility with a wide range of editors and even direct web embedding. You’re never locked out of the file just because your team uses different tools.
Who Benefits Most and How They Apply It
The template’s design language is broad enough to serve multiple audiences, yet specific enough to feel authoritative for ecological content. Let’s look at a few roles where the tool integrates directly into daily responsibilities.
Educators and Trainers
A high school science teacher developing a unit on climate change can download the template, select the timeline-focused variant, and chart historical CO₂ levels alongside average global temperatures. The class sees the correlation in one clean graphic rather than two disjointed charts. Because the file is customizable, the teacher can add annotations or discussion questions right on the infographic, turning it into a reusable teaching aid that works for both live lectures and online learning platforms.
Environmental Activists and NGOs
Campaigners often operate with limited design budgets. Ecology Infographic Template V4 empowers them to produce professional-looking visuals for petitions, email newsletters, or rally signage without waiting for a designer. A volunteer can take recent water test data from a local stream, plug the numbers into the template’s pre-built stat blocks, change the map region, and have a shareable graphic ready in under an hour. Speed matters when you’re responding to a live issue like pollution spills or deforestation alerts.
Policy Makers and Government Planners
When presenting to a city council or a budget committee, clarity carries as much weight as evidence. A policy advisor can use the template to create a one-page overview summarizing the economic impact of coastal erosion, the projected cost of inaction, and the recommended intervention. The structured layout helps non-scientific audience members follow the reasoning linearly, making the case more persuasive. Later, that same graphic can be adapted into a public report, saving duplicate effort.
Marketers and Small Business Owners
A sustainable brand’s product launch or a green consultancy’s case study gains traction when supported by visuals that convert skepticism into trust. The template helps marketers highlight impact metrics—carbon offset totals, recycled material percentages—in a format that feels both credible and shareable. The three design variations allow you to create a series for a drip campaign without repeating the same look, holding interest over a multi-email sequence or a multi-week social media push.
Integrating the Template Into Long-Term Communication Plans
A common mistake is treating an infographic as a one-off asset. Instead, think of Ecology Infographic Template V4 as a communication pattern you can revisit. When a new quarterly report comes out, you pull the same template, update the numbers, and publish. Your audience begins to recognize the visual signature, which builds trust and recall. Over time, you develop a library of re-skinned infographics that tell an evolving story of conservation progress—or alert them to worsening trends—without the recurring design overhead.
This repetitive but efficient approach works especially well for organizations that report on environmental metrics annually or seasonally. A standardized template ensures data is presented consistently, making year-over-year comparisons easier for stakeholders to digest.
Getting Started and Making Your Data Shine
Downloading Ecology Infographic Template V4 gives you immediate access to all file formats. Open the one that matches your software, explore the three design options, and duplicate the page you want to customize. Keep in mind that the product’s preview images are for demonstration only and are not included in the main file—this ensures you start with a clean slate free of watermarked placeholders. Replace them with your own photographs, charts, or illustrations, and your infographic gains an original, data-backed identity.
In a time when environmental challenges demand urgent attention but attention spans are increasingly fragmented, the ability to turn raw information into stunning, digestible visuals is not a luxury—it’s a core competency. Ecology Infographic Template V4 supports that competency with a thoughtful combination of design variety, editing ease, and cross-platform flexibility. Whether you’re an educator sketching out a lesson, an activist rallying support, or a policy maker seeking funding, the template helps your data not just sit on a screen, but truly shine.