Business Infographic Template V1: Data Visuals Simplified
Numbers on their own rarely tell a story that sticks. Whether you are sharing quarterly results, mapping a marketing funnel, or outlining a project timeline, the way data looks decides whether people tune in or tune out. Business Infographic Template V1 was built to bridge that gap—offering a practical, ready-to-use design foundation that turns everyday business figures into polished visual assets. Instead of wrestling with blank canvases or piecing together mismatched charts, you get a head start with layouts that already feel professional and easy to read.
What makes this template stand out is not just about looking good—it is about reducing friction. You can drop in your own metrics, adjust colors to match a brand, and reshuffle sections without breaking the structure. Because the file remains fully editable in widely used design software, both beginners and experienced creators can work at their own pace. The result is communication that feels intentional, not hastily assembled.
What You Actually Get With Business Infographic Template V1
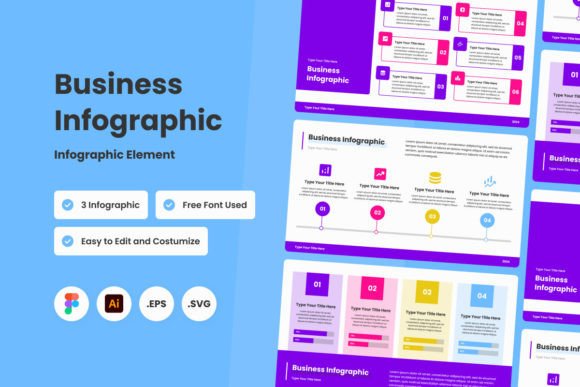
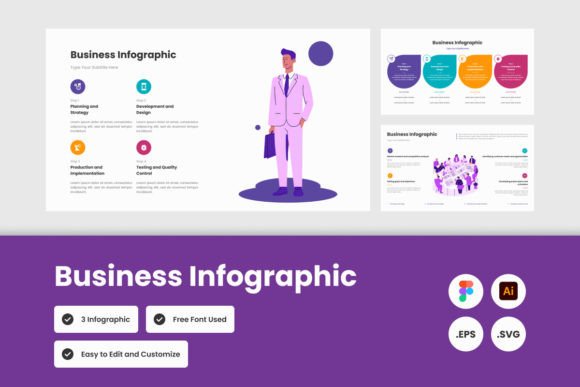
At its core, Business Infographic Template V1 is a set of pre-designed visual frameworks meant to house business data. Think of it as a visual blueprint. Instead of staring at an empty artboard, you open a file that already has placeholders for headlines, charts, timelines, comparison tables, and icon-driven lists. The template comes in three distinct stylistic variations, so you can pick a look that fits formal boardroom summaries or more dynamic marketing one-pagers.
The pack includes fully organized layers, which means every bar chart, text box, and decorative element sits on its own named layer. This keeps frustration low when you need to tweak just one percentage value or swap out an icon. Because the fonts used are open source, anyone can open the file without hunting down expensive typefaces. Even better, the template ships in multiple formats—.Fig, .Ai, .Eps, and .Svg—covering everyone from Figma loyalists to Adobe Illustrator users and those who prefer vector editing in other tools.
Why Clear Data Design Matters More Than Ever
In a world where attention shifts in seconds, business visuals act as decision shortcuts. A well-designed infographic can condense a twenty-page report into a single scrollable image. It helps stakeholders spot trends without poring over spreadsheets and gives teams a shared reference point. Yet building those visuals from scratch often means hours of formatting, aligning, and second-guessing color choices.
Business Infographic Template V1 removes that hidden labor. By offering consistent proportions, harmonious color palettes, and logical content flow, it frees you to focus on the message rather than pixel-perfect alignment. The design already incorporates breathing room, readable data labels, and visual hierarchy—details that non-designers may overlook until a slide looks cluttered. It essentially bakes in good design habits so your output feels credible and easy to digest.
Who Finds the Most Value in This Template
The audience for a tool like this spans far beyond traditional graphic design circles. Here are a few groups that naturally benefit:
- Small business owners and entrepreneurs who need to pitch ideas, summarize performance, or create social media content without a dedicated design budget.
- Marketing professionals looking to turn campaign data, audience insights, or competitive analysis into client-ready visuals.
- Freelancers and consultants who want to elevate deliverables—think proposal decks, monthly reports, or case studies—with consistent branding.
- Educators and trainers transforming dry statistics into engaging handouts or presentation slides.
- Bloggers and content creators who need shareable, infographic-style summaries that drive engagement on websites and social platforms.
Because the template does not lock you into a single niche aesthetic, it can shift easily from a serious corporate earnings snapshot to a brighter, more modern startup pitch. The three design variations give you room to match the personality of the project without starting over every time.
Practical Scenarios Where Business Infographic Template V1 Shines
To understand its real-world utility, consider a few common tasks. Imagine you have monthly sales figures across four regions. Instead of listing numbers in an email, you can open the template, choose a comparison layout, and plug in the data. In minutes, you have a visual that shows regional performance side by side—perfect for a team update or a slide in a management review.
Or picture a product launch timeline. The template’s modular structure lets you map milestones with icons and short descriptions, transforming a confusing Gantt chart into a clean, sequential flow. Marketing teams often use such visuals in pitch decks or on landing pages to help potential clients understand project roadmaps at a glance. Another use case is turning customer survey results into a digestible infographic for a company newsletter. With layered elements, you can quickly highlight key percentages and satisfaction scores without reinventing the wheel.
Even internal documents like onboarding guides or process overviews benefit. A new hire might glance at an org chart or workflow illustration built from the template and instantly grasp how things connect. The same logic applies to non-profit reports, freelance portfolio pages, or academic poster presentations—anywhere that blending information with design matters.
What Sets the Template Apart When You Open the File
Many infographic bundles look stunning in previews but become a headache to edit. Business Infographic Template V1 prioritizes usability behind the scenes. The neat layer organization is a small detail that makes a big difference. You do not waste time clicking through unnamed groups or hidden masks. Everything is logically grouped—headline text, data charts, background shapes—so you can isolate what you need within seconds.
The open source font choice also deserves attention. There is no risk of missing font warnings when sharing files with colleagues or clients. Everyone sees the same clean typography without additional purchases. And because the pack includes .Fig, .Ai, .Eps, and .Svg formats, you are not painted into a corner if your preferred software changes down the line. Figma users can collaborate online, Illustrator users can fine-tune vector details, and those working in simpler vector apps can rely on the SVG version. This cross-compatibility future-proofs your designs and makes the template a reliable asset for teams using different tools.
Keeping It Your Own: Customization Without Overwhelm
A common concern with templates is that they force a generic look. This one is designed to be a starting point, not a final stamp. You can adjust colors to match brand guidelines in a few clicks, swap placeholder icons for relevant symbols, and modify chart styles to suit your data range. Because the structure is based on flexible vector elements, scaling never introduces blurriness—so you can resize for everything from a slide deck to a large poster without quality loss.
Even if you do not consider yourself a designer, the barrier is low. Changing text, pulling in a logo, or reordering sections follows the same basic software skills you might use in a word processor or slide builder. More advanced users can dig deeper, adding animation later or exporting specific sections as standalone graphics. The template’s adaptability means it grows with your skill level, rather than capping what you can create.
Important Points Before You Download
Like any design resource, a few realities are worth knowing upfront. All images shown in previews are for demonstration purposes only and are not included in the main file. The visual mockups show how the template could look with photography, but the actual download provides the structure, vector elements, and text placeholders—not the stock photos. This is standard practice and means you can insert your own licensed imagery or keep the design minimal.
Additionally, while the template works in multiple vector editing programs, you need access to at least one of them to edit the file. It is not a browser-based tool you can modify without software like Figma (free) or Adobe Illustrator. The learning curve for these applications is manageable, but complete newcomers might need a quick orientation. However, the organized layers and clear labels reduce that initial confusion significantly.
Lastly, because the template offers three distinct design styles, it can be tempting to mix and match elements across them. That is entirely possible, though keeping some visual consistency within a single project usually yields stronger results. Consider picking one variation as your base and borrowing only small accents from the others if needed.
A Quick-Start Approach for Non-Designers
If you are approaching infographics for the first time, start with the simplest variation in the pack and plug in your core numbers first. Focus on clarity rather than decoration. Use the built-in color palette as a guide, and only swap brand colors after you have the data in place. This prevents the common pitfall of spending forty minutes perfecting a shade of blue while the content remains empty.
Next, look at the hierarchy already built into the template. Headlines, subheadings, and supporting stats are deliberately sized to lead the eye. Resist the urge to make everything bigger. Let the design’s rhythm do the work. If you need to localize content, the open source fonts also support many languages, keeping the text crisp without extra configuration.
Why This Template Belongs in Your Workflow
Business Infographic Template V1 succeeds not because it tries to be the flashiest option, but because it solves a recurring problem: turning raw business data into visuals that people actually understand and remember. It strips away the complexity of building infographic layouts from scratch and gives you a solid, customizable foundation that works across several industries and use cases.
Whether you are preparing a monthly marketing report, launching a new product, or teaching a concept to a room full of learners, the template helps you show, not just tell. And because it lives in flexible vector formats, your finished work can travel from a digital dashboard to a printed handout without a single quality compromise. When data looks this clear, the insights inside it become impossible to ignore.