Mastering Strategic Clarity: How SWOT Infographic Templates Transform Business Analysis
In a world overflowing with data, the challenge for any leader, entrepreneur, or student is not finding information—it’s making sense of it. When you sit down to map out the future of a venture, a product, or even a personal career move, you need a framework that cuts through the noise. The SWOT analysis remains one of the most enduring and powerful tools for that very purpose. But a simple handwritten list of strengths, weaknesses, opportunities, and threats can feel forgettable. This is where visual storytelling changes the game. A professionally designed SWOT infographic template, like the SWOT Infographic Template V1, bridges the gap between raw analysis and compelling communication, turning static data into a strategic narrative that informs, persuades, and inspires action.
What is a SWOT Analysis and Why Does It Matter?
SWOT stands for Strengths, Weaknesses, Opportunities, and Threats. Harvard Business School professor Kenneth Andrews developed this framework in the 1960s, and it has since become a staple in boardrooms, startups, and classrooms worldwide. At its heart, a SWOT analysis is a structured way to evaluate the internal and external factors that affect success.
Strengths and Weaknesses are internal attributes—things you can control. A strength could be a patented technology, a loyal customer base, or a uniquely skilled team. A weakness might be limited resources, outdated processes, or gaps in expertise. Opportunities and Threats, in contrast, exist outside the organisation. An opportunity could arise from a shifting market trend, a regulatory change, or an underserved customer need. Threats might include emerging competitors, economic downturns, or supply chain disruptions.
When done correctly, a SWOT analysis does more than just list pros and cons. It forces a reality check. It pushes teams to separate assumptions from evidence and unearths blind spots that gut-feeling decisions often miss. The problem? Many SWOT analyses end up as messy whiteboard scribbles or bullet-point-heavy documents that fail to resonate. That’s a missed opportunity for insight.
The Power of Visuals in Strategic Thinking
Human brains process visuals 60,000 times faster than text. When you translate a SWOT framework into an infographic, you do more than decorate a slide—you fundamentally enhance comprehension and retention. A visual layout instantly clarifies the relationship between the four quadrants. Readers can see, at a glance, how internal strengths connect to external opportunities, or how weaknesses might amplify certain threats.
Research in cognitive psychology tells us that dual coding—combining verbal and visual information—creates stronger memory traces. An infographic SWOT template uses colour psychology, iconography, and spatial organisation to reduce cognitive load. A green, upward-pointing section for Strengths signals growth instinctively. A red or amber zone for Threats triggers vigilance. This visual shorthand means that whether you are presenting to investors, colleagues, or a classroom, your message lands faster and sticks longer.
But not all infographics are created equal. A cluttered, poorly balanced design can confuse more than it clarifies. That’s why choosing a template built with both aesthetic appeal and functional logic matters. The right template doesn’t force your ideas into rigid boxes; it gives you a canvas that elevates your content without stealing the spotlight.
Introducing the SWOT Infographic Template V1: A Structured Approach to Clarity
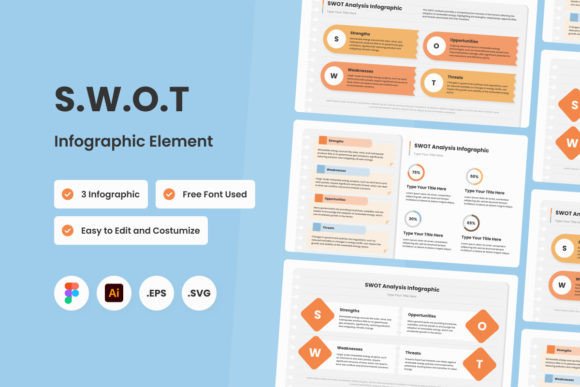
The SWOT Infographic Template V1 was designed for one reason: to make strategic analysis not only easier to build but far more impactful to share. It provides a structured, visually engaging way to conduct a SWOT analysis, making it perfect for strategic planning sessions, quarterly business reviews, competitive analysis, and academic projects alike. Instead of starting from a blank page, you begin with a framework that guides your thinking while giving you complete creative control.
What makes this template stand out is its understanding that different contexts demand different visual tones. That’s why it ships with three unique design variations. One might feature a sleek, corporate look with clean lines and muted palettes ideal for a formal board presentation. Another could offer a more vibrant, modern aesthetic suited for a marketing strategy pitch or a startup investor deck. The third might focus on clarity and simplicity, perfect for educational handouts or internal team workshops. Having these options means you can match the visual language to your audience without redesigning from scratch.
Key Features That Redefine Customisation
Many templates promise flexibility but deliver frustration. The SWOT Infographic Template V1 tackles this head-on with an intentional blend of powerful features.
1. Easy Customisation Without Compromise
Ease of customisation isn’t just a buzzword here—it’s a core design principle. Each element, from the colour-coded SWOT quadrants to the icon placeholders and text boxes, uses well-organised, neatly named layers. This means you won’t waste time hunting through a chaotic layer panel. You can swap colours to match your brand palette with a few clicks, adjust fonts, or completely restructure the layout—all without breaking the design. For non-designers, this reduces the intimidation factor. For seasoned professionals, it means speed.
2. Neat Layers for Stress-Free Editing
Digging into a .psd or .ai file only to find “Layer 142 copy copy” is a common nightmare. Here, all elements are logically grouped and labelled. You can quickly identify the “Strengths” section, isolate its background, adjust its typography, or even animate individual components if you move the file between software. This organisation dramatically cuts down on production time, especially when you need to create multiple versions for different departments or clients.
3. Open Source Fonts Mean No Headaches
One of the most overlooked aspects of template sharing is font licensing. Many attractive templates use premium typefaces that either lock you into a paid subscription or break when you open the file on a different machine. The SWOT Infographic Template V1 uses exclusively open source fonts. These free, accessible typefaces ensure that your design looks identical on every device, and you can share files with collaborators without worrying about missing assets. It also means you can use the template for commercial projects with full peace of mind.
4. Multi-Format Flexibility for Real-World Workflows
Design ecosystems are rarely monolithic. You might sketch a concept in Figma during a team brainstorm, refine it in Adobe Illustrator for print, and then export an SVG for a responsive web dashboard. This template includes .Fig, .Ai, .Eps, and .Svg formats. That’s not just generosity; it’s a recognition of how modern work happens. The .Fig file supports real-time collaboration, making it invaluable for remote strategy meetings. The .Ai file gives print-ready precision. .Eps and .Svg ensure compatibility with almost any vector editing tool or content management system.
Where SWOT Infographics Shine: Practical Applications
A tool is only as good as the problems it solves. The SWOT Infographic Template V1 finds its place across a surprising range of scenarios.
Business Reviews and Strategic Planning: When presenting annual results or quarterly strategies, a visual SWOT immediately grounds the conversation. Executives can see competitive advantages mapped next to emerging risks, fostering data-driven debate. It moves meetings away from vague opinions toward structured dialogue.
Marketing and Brand Audits: Marketers use SWOT to evaluate brand positioning. A visual template helps them overlay customer perception data on internal brand attributes, creating a clear picture of where messaging should double down or pivot.
Startup Pitch Decks: Investors see dozens of decks a week. A crisp, one-slide SWOT infographic demonstrates that the founding team understands their market honestly and deeply. It shows maturity and reduces doubt.
Educational Purposes: In business schools and workshops, students often struggle to separate internal from external factors. A visual template acts as a cognitive scaffold, physically separating the quadrants and reinforcing the conceptual distinction.
Personal Career Planning: Even individuals can benefit. Plot your own professional strengths and weaknesses against job market opportunities and threats. The visual output can clarify career transitions or upskilling priorities in a way a running document never could.
Getting the Most From Your SWOT Infographic: A Quick Method
Even the most beautiful template won’t save a shallow analysis. Combine the visual power of the template with a rigorous thinking process:
- Start Inside. Before looking outward, exhaustively list your true internal strengths and weaknesses. Be brutally honest. This isn’t a marketing puff piece; it’s a diagnostic tool.
- Then Scan Outside. Look at industry reports, competitor moves, and broader PESTLE factors (Political, Economic, Social, Technological, Legal, Environmental). Every opportunity should have a source. Every threat should be tracked to a specific trend or competitor action.
- Connect the Quadrants. The real magic of SWOT happens at the intersections. How can you use a strength to seize an opportunity? Which weakness makes a specific threat dangerous? Draw these links and make them visually obvious in your infographic—perhaps with connecting lines or shared icons.
- Prioritise Ruthlessly. Not all factors are equal. Use colour intensity or size variation inside the template to signal priority. Your audience should immediately see the top three action drivers.
- Review and Update. A SWOT is a snapshot, not a monument. Treat the template as a living document. Schedule quarterly updates, and use version history to track strategic evolution over time.
Addressing Common Misconceptions
Some professionals dismiss SWOT as overly simplistic. They argue that real strategy is messier, more emergent. This criticism usually stems from poor execution, not inherent flaws in the model. A well-crafted SWOT infographic doesn't pretend to be a complete strategy—it’s a catalyst for deeper conversation. It prompts questioning: “Do we really have this strength, or is it wishful thinking?” “Has this threat been quantified?” The template becomes a canvas for this exploration, not a final answer.
Another misunderstanding is that SWOT must be a solo exercise. In fact, its value multiplies when built collaboratively. Using a shared Figma file from the template, for example, invites cross-functional input. Sales teams flag on-the-ground threats that executives might miss. Product developers point out technical strengths that marketing undervalues. The visual result captures a richer, more accurate picture.
Why Your Data Deserves Stunning Visuals
In an age of information overload, aesthetic quality is not vanity—it’s a signal of respect. When you invest effort in presenting your analysis in a clean, engaging format, you communicate that the insights inside are worth attention. The SWOT Infographic Template V1 helps you turn raw data into a story that an audience will lean into, not away from. You don’t need to be a graphic designer. You just need a framework that understands both design logic and strategic depth.
The attention to detail in this template—from the open-source fonts to the fully layered, multi-format delivery—reflects a practical understanding of professional workflows. It’s built for people who want their ideas to be seen clearly and remembered. Whether you’re downloading it for a single high-stakes presentation or embedding it into your ongoing planning rhythm, you’re equipping yourself with more than a pretty slide; you’re adopting a mindset that treats clarity as a strategic advantage.
As you prepare your next analysis, remember that the best strategies are the ones that people can actually understand and rally behind. A SWOT infographic doesn’t just identify patterns; it makes those patterns visible, shareable, and actionable. With the right template, you’re not just analysing your business—you’re illuminating its path forward.